
How to Value an Apartment Building in Los Angeles
Q4 2026
Key Takeaways
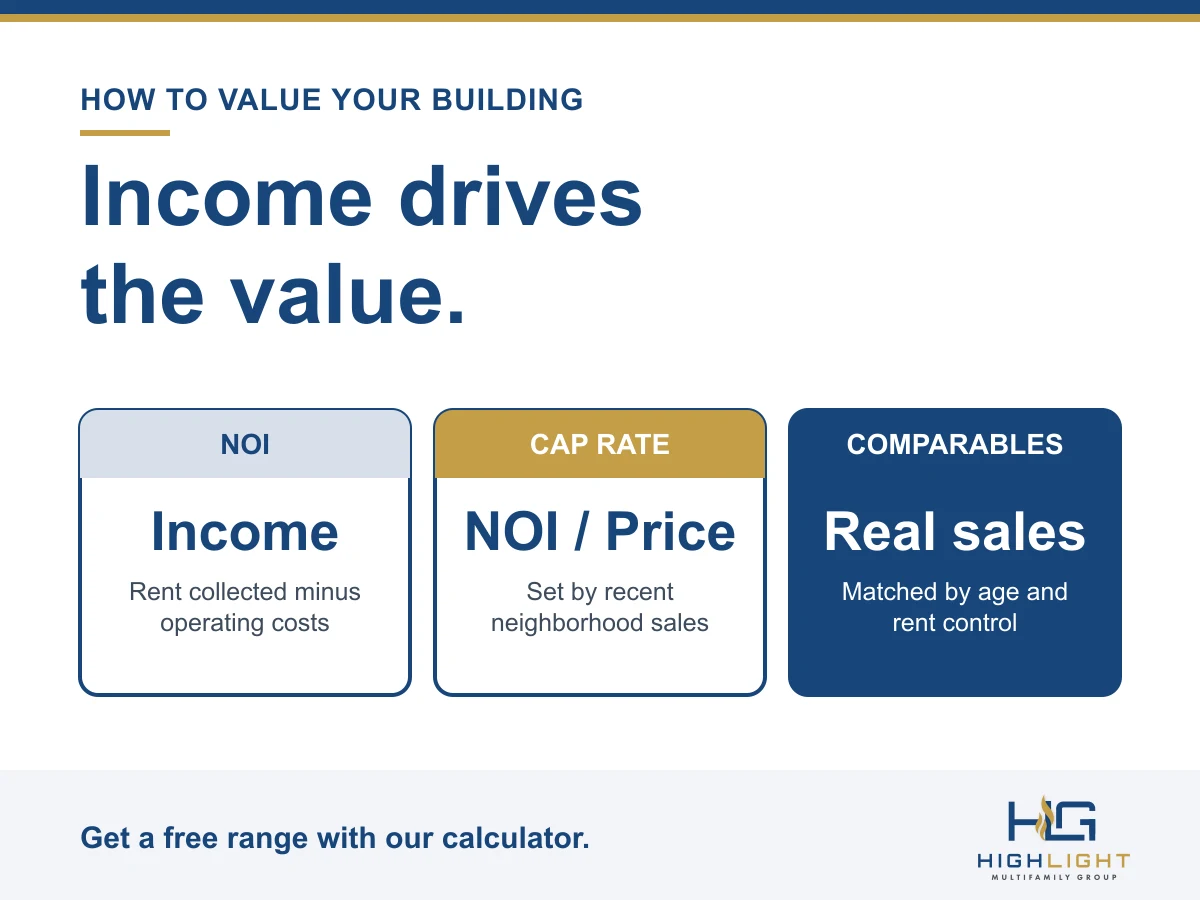
Buyers value an apartment building mainly on its income, not its looks or its asking price. The core measure is net operating income (NOI) divided by a market cap rate, checked against recent comparable sales.
In Los Angeles, rent control and building age change the math. Buildings built before 1978 (rent stabilized) trade differently from newer ones, so comparable sales have to match.
Condition, deferred maintenance, and in-place rents versus market rents move the price as much as the headline numbers do.
A calculator or a rule of thumb gives you a range. A Broker Opinion of Value built on your actual rent roll and expenses gives you a number you can plan around.
1. Net Operating Income: The Core of Value
Net operating income is the building’s collected rent and other income, minus the cost of operating it. It does not include your mortgage payment, depreciation, or income taxes. Because a buyer is paying for that income stream, NOI drives price more than any other number.
Two things trip owners up. First, buyers use realistic expenses, not just what you happen to pay today. They will re-underwrite property taxes, because California reassesses a building when it sells, and our offering memorandums typically assume about 1.2% of the sale price. Second, hidden expense problems come out in due diligence, which is why we recommend owners watch their bills, as we explain in our article on tracking utility bills.
2. Capitalization Rate (Cap Rate)
The cap rate is NOI divided by price. Flip it around and you get a quick estimate of value: NOI divided by the cap rate. For example, a building with $100,000 of NOI that buyers are pricing at a 5.5% cap rate is worth about $1.8 million. A lower cap rate means buyers are paying more for each dollar of income.
Cap rates are not one number across Los Angeles. In 2026 sales through September, rent-stabilized buildings (built before 1978) with a recorded cap rate traded at a typical range of 5.86% to 7.34% in Koreatown, 5.55% to 6.98% in North Hollywood, and 4.81% to 5.96% in Santa Monica. We publish these ranges, with the number of sales behind each, on our neighborhood pages.
3. Gross Rent Multiplier (GRM)
The gross rent multiplier is price divided by annual gross rent. It is a fast screen, and buyers and brokers use it to compare buildings at a glance, but it ignores expenses, so two buildings with the same GRM can have very different NOI.
A real example: our listing at 3815 Don Tomaso Dr is priced at $1,300,000, which is a 10.35 GRM and a 6.04% cap rate on in-place rents. The two numbers tell different parts of the story, which is why we look at both.
4. Price Per Unit and Price Per Square Foot
Price per unit and price per square foot are the quickest ways to compare a building with recent sales. They are sanity checks, not valuations, because they ignore income, condition, and rent levels.
They also vary widely by neighborhood. Among rent-stabilized buildings sold so far in 2026, the median price per unit was about $173,700 in Koreatown, $189,500 in North Hollywood, and $388,300 in Santa Monica, and the median price per square foot was $230, $247, and $398. A figure from the wrong neighborhood can be off by hundreds of thousands of dollars.
5. In-Place Income Versus Pro Forma
Buyers look at two sets of numbers: what the building earns today (in-place) and what it could earn at market rents (pro forma). The gap between them is called loss to lease, and it is where much of the negotiation happens.
At 3815 Don Tomaso, in-place rents sit about 47% below market, a loss to lease of $4,904 per month. Reaching market rents through normal turnover would lift NOI from $78,553 to $129,231 and the cap rate from 6.04% to 9.94%. Buyers will pay for that upside, but only partly, because under rent control they cannot capture it until units turn over. We explain how in our guide to selling with tenants under rent control.
6. Comparable Sales and Market Evidence
The strongest evidence of value is what similar buildings actually sold for. A good comparable is recent, in the same neighborhood, close to your size and age, and has the same rent-control status. Sales of buildings built before 1978 and after 1978 should not be mixed, because the price per unit gap is large: across LA County in 2026 the median was about $220,000 per unit for pre-1978 buildings and about $331,000 for newer ones.
You can see how we have priced and sold buildings across Los Angeles on our closed sales page.
7. Physical Condition and Capital Expenses
Buyers subtract what they expect to spend. Roofs, plumbing, electrical systems, and required inspections all come off the price. At 1513 Arlington Ave, for example, the building had Federal Pacific electrical sub-panels that insurers increasingly require owners to replace, plus a state-mandated balcony inspection under SB 721. Our seller did not want to pay for either before closing, so we structured the sale for the buyer to take them on, as described in the case study.
In general, we advise sellers against spending money on the property before a sale, because they rarely get it back from buyers. Experienced investors have their own plans and cost-effective ways to bring a building up to market.
8. Rent Rules and Regulation
Rent control limits how fast income can grow, so it directly affects value. Buildings built before October 1, 1978 are generally covered by the City’s Rent Stabilization Ordinance, and newer buildings fall under the statewide cap explained in our article on the 2026 AB 1482 rent cap.
Taxes on the sale itself matter too. In the City of Los Angeles, a building sold above about $5.4 million is hit by Measure ULA, which can change your net proceeds sharply. Read our Measure ULA guide before pricing a building near that line.
9. Financing and the Buyer Pool
Interest rates and lending standards decide what buyers can pay. When financing is expensive, cap rates rise and values fall, and when it loosens, the reverse happens. A building also sells for more when it reaches the widest pool of qualified buyers, including investors who are exchanging out of another property.
10. How the Building Is Positioned for Sale
The same building can sell for different prices depending on how it is marketed. An accurate offering memorandum, an open house for brokers and buyers, and a clear story about upside all help. At 1513 Arlington Ave, an open house for brokers and buyers drew offers from 12 buyers.
What Is Your Building Worth?
For a quick range, try our free property value calculator, which uses real 2026 sales in your neighborhood and splits rent-stabilized buildings from newer ones. For a number you can plan around, request a free Broker Opinion of Value and we will build it from your actual rent roll, expenses, and condition. If you are still deciding whether to sell, start with our seven questions to ask first.
Sales figures are medians or ranges from closed LA County multifamily transactions in 2026 through September, and only appear where enough sales reported the figure. This article is general information, not an appraisal or investment advice.
Frequently Asked Questions
How is an apartment building valued in Los Angeles, and how do I figure out what mine is worth?
Mainly on its income, not its looks or its asking price. The core measure is net operating income (NOI) divided by a market cap rate, checked against recent comparable sales. In Los Angeles, rent control, building age, condition, and in-place rents versus market rents also move the price.
What is a cap rate, and how do I use it to figure out what my building is worth?
The cap rate is NOI divided by price. Flip it around and value is NOI divided by the cap rate. For example, a building with $100,000 of NOI that buyers are pricing at a 5.5% cap rate is worth about $1.8 million. A lower cap rate means buyers are paying more for each dollar of income.
What is a good cap rate for an apartment building in Los Angeles?
It depends on the neighborhood. In 2026 sales through September, rent-stabilized buildings (built before 1978) with a recorded cap rate traded at a typical range of 5.86% to 7.34% in Koreatown, 5.55% to 6.98% in North Hollywood, and 4.81% to 5.96% in Santa Monica. See our cap rates and prices by neighborhood and each neighborhood page for the number of sales behind each range.
How much is an apartment building worth per unit in Los Angeles?
No. Price per unit and price per square foot are quick sanity checks, not valuations, because they ignore income, condition, and rent levels. They also vary widely: among rent-stabilized buildings sold so far in 2026, the median price per unit was about $173,700 in Koreatown, $189,500 in North Hollywood, and $388,300 in Santa Monica.
Does rent control lower the value of my apartment building?
Rent control limits how fast income can grow, so it directly affects value. Buildings built before October 1, 1978 are generally covered by the City’s Rent Stabilization Ordinance, and newer buildings fall under the statewide cap. Buyers price a building on the rents in place and give only partial credit for upside, because under rent control they cannot capture it until units turn over.
How can I find out how much my apartment building is worth for free?
For a quick range, try our free property value calculator, which uses real 2026 sales in your neighborhood. For a number you can plan around, request a free Broker Opinion of Value, built from your actual rent roll, expenses, and condition.