
LA Apartment Market Report, October 2026: Prices, Cap Rates, and the 10-Year Treasury
Q4 2026
Key Takeaways
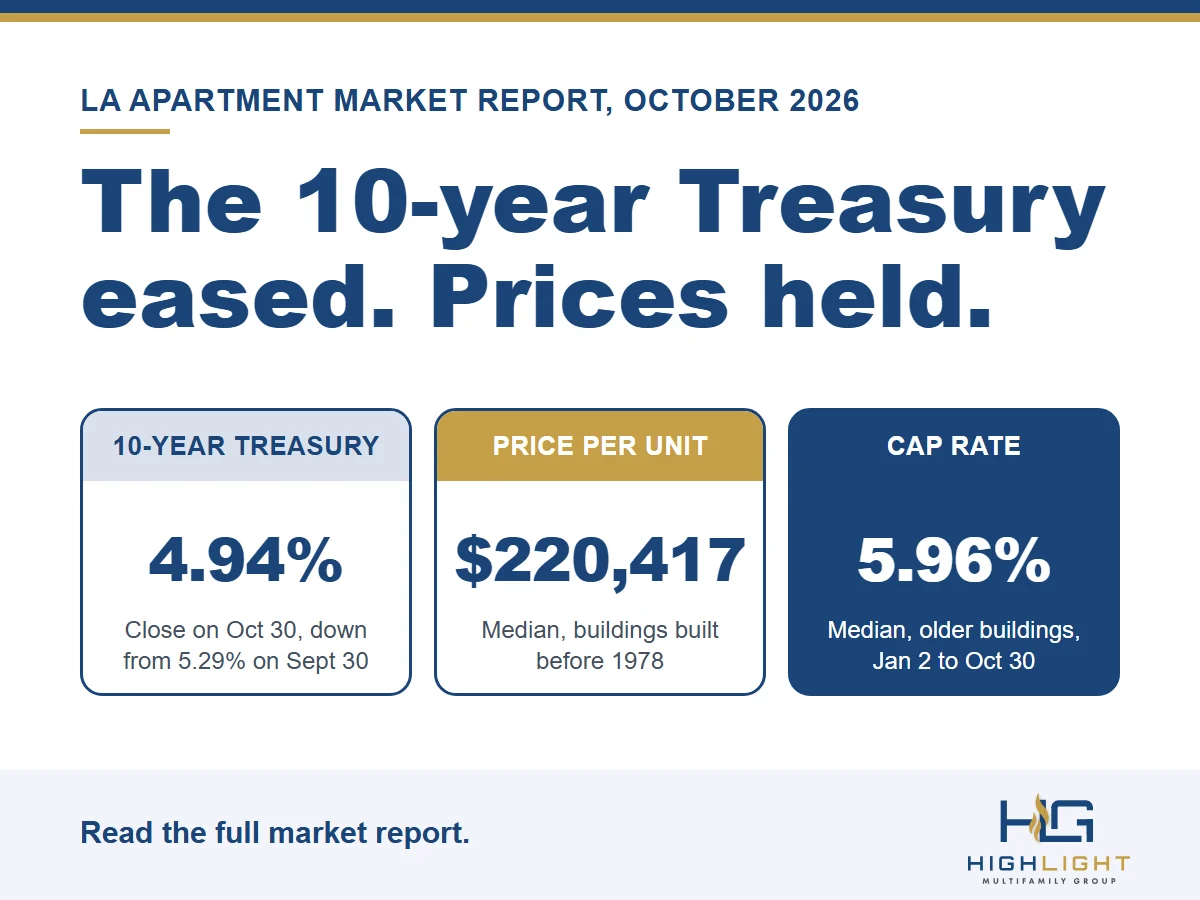
The 10-year Treasury yield ended October at 4.94%, down from 5.29% on September 30. It peaked at 5.31% on October 5, so the month was a retreat of about 35 basis points from the end of September.
Prices held. From January 2 through October 30, older LA County apartment buildings (built before 1978) sold for a median of $220,417 per unit, essentially where they started the year.
Cap rates did not follow Treasury yields up. The median cap rate on older buildings stayed near 6.0% while the 10-year climbed more than a full point from its February low, so buyers are earning a thinner premium over the Treasury than they were in January.
CoStar’s October market report describes a split market. New, higher-priced buildings carry most of the vacancy, while demand for older, lower-priced units has held up. Overall vacancy is 5.5% and asking rents are up just 0.4% over twelve months.
In our view, October gave owners and buyers some relief on interest rates, but not a reason to expect a rebound in prices. The owners who do best this year are the ones who price from income and comparable sales.
Where the 10-Year Treasury Ended October
The 10-year Treasury closed at 4.94% on Friday, October 30, the last trading day of the month. It opened October at 5.24% and reached 5.31% on October 5. A sharp drop on October 22 took it to 4.96%, it hovered around 5% for the rest of the month, and it finished at its low for the month. The monthly average was 5.14%, up from 4.99% in September.
The bigger picture is the climb. The 10-year hit its low for the year, 3.97%, at the end of February, and averaged 4.21% in January. By the end of September it had risen to 5.29%. October’s decline took back about a quarter of that rise.
Why this matters to an apartment owner: lenders generally price multifamily loans as a spread over Treasury yields of a similar term. When the 10-year rises, the cost of a new loan tends to rise with it, which lowers what a buyer can pay for a given amount of income. We do not try to explain individual days in the bond market, and a one-month move can reverse. What we watch is whether the yield settles below 5%.
Cap Rates Have Not Moved With Treasury Yields
Here is what stands out in our sales data. The median cap rate on older LA County buildings was 5.88% in January and 5.97% in September. Over the same months, the average 10-year yield went from 4.21% to 4.99%.
That means the gap between the cap rate buyers accepted and the Treasury yield narrowed from about 1.7 percentage points in January to about 1.0 in September. Measured against October’s closing yield, the median cap rate for the year so far is about 1.0 points above the 10-year.
A thin gap like this has to resolve one of three ways: cap rates drift up, Treasury yields come down, or rents grow enough to lift income. October’s move helped with the second. The CoStar section below explains why we would not count on the third. We are also careful with the word “spread” here. A building’s cap rate is based on income before debt, and a buyer’s loan costs more than the Treasury yield, so this is a gauge of the market’s mood, not a measure of any one buyer’s returns.
What Sold Through October 30
Our sales analysis now runs from January 2 through October 30, 2026. It covers 1,369 sales of LA County apartment buildings with 5 to 99 units, worth about $4.57 billion, taken from CoStar sales data. We leave out sales whose price CoStar marks as approximate or allocated, portfolio sales of 100 or more units, and repeated records.
Older buildings sold for a median of $220,417 per unit and $287 per square foot, with a median cap rate of 5.96%. Buildings built in 1978 or later sold for a median of $320,000 per unit at a 5.60% median cap rate.
By quarter, the median price per unit for older buildings was $220,000 in the first quarter, $219,167 in the second, and $221,429 in the third. The first weeks of the fourth quarter show $237,778, but treat that as a preview. October’s sales are still being recorded (116 so far, against 148 in September), and the 41 cap rates reported for older buildings are too few to say that cap rates moved.
Size still matters. Older buildings of 5 to 9 units sold for a median of $237,222 per unit, compared with $200,000 for 10 to 19 units and $181,548 for 20 to 49 units.
Sellers still gave ground on price. Among sales with a recorded asking price, the median sale was 94% of asking, about $145,000 below it. Only 14% sold at or above asking, and 27% sold for more than 10% less.
What CoStar’s October Market Report Shows
CoStar’s Los Angeles multifamily report, dated October 30, 2026, puts overall vacancy at 5.5%, below the national average of 7.9% but high for California. The split is by quality. Vacancy in the newest, highest-priced buildings (4 and 5 Star) is 9.4%, against 5.4% for 3 Star and 4.6% for 1 and 2 Star buildings, which include many older apartments.
Rents are flat. Asking rents rose 0.4% over the past twelve months, and CoStar notes that rent growth has stayed at or below 1% for several years. In the higher-priced buildings, landlords are offering one to two months of free rent, and more in the weakest submarkets. Renters absorbed about 7,792 net units over the year, against about 9,378 new units delivered.
The demand side is soft. CoStar points to population loss, slower job growth, and the loss of roughly 60,000 jobs in the information sector (tech and entertainment) since 2023, which has shrunk the pool of renters who can afford new, higher-priced apartments.
On supply, about 17,712 units are under construction, which CoStar describes as the lowest level since 2015, after several years of falling construction starts. CoStar’s forecast has vacancy beginning to compress around mid-2027 and rent growth recovering after that, reaching about 1.5% by mid-2028.
On sales, CoStar estimates that LA multifamily volume over the past twelve months was about $8.0 billion, close to the prior twelve months and in line with the ten-year average. It puts the market-wide price at roughly $340,000 per unit, more than 20% below the 2021 peak of about $430,000. That figure covers every size and age of building, including new construction, so it runs well above what older buildings sold for in our data. CoStar’s outlook is that prices have probably reached their low and that the rise in cap rates over the past two years has leveled off, but that getting back to earlier price levels will take years.
Institutional investors are less active. CoStar reports that institutions made up 8% of sellers and 13% of buyers in 2026, down from 13% and 16% before Measure ULA took effect. In our own data, about 82% of buyers were private, and institutions were about 2%.
Neighborhood Notes
Santa Monica. CoStar lists Santa Monica among the weakest submarkets for vacancy at 8.1%, behind a wave of new buildings, with landlords offering extra months of free rent. Older buildings in our sales data are a different story. They sold for a median of $387,500 per unit, among the highest in our neighborhood data. See our Santa Monica market page.
Koreatown. CoStar ranks Koreatown second in the county for units under construction, so competition from new buildings is a factor there. Older Koreatown buildings sold for a median of $161,875 per unit in our data. See our Koreatown market page.
South LA. CoStar shows the tightest vacancy in the county in South Los Angeles (3.5%) and Southeast Los Angeles (3.6%), where there is little new construction. Older South LA buildings sold for a median of $146,354 per unit. See our South LA market page.
For every neighborhood, see our guide to LA apartment cap rates and prices by neighborhood.
Our Read: What This Means for Owners
The market is split by building type, and older buildings sit on the steadier side. CoStar’s numbers show demand holding up for lower-priced units while new buildings fight for renters. That helps explain why older-building prices have been so stable this year. It does not mean rents will jump. With rent growth near zero, the income side of a valuation is not going to carry prices higher on its own.
Rates matter more than rents right now. If the 10-year stays below 5%, the financing math improves for buyers and gives cap rates room to hold. If it climbs back, we would expect buyers to push harder on price, since the gap over the Treasury is already thin. Either way, a seller should be ready for buyers to negotiate.
Price from income, not hope. With the median sale closing at 94% of asking, an asking price that your rents and recent sales do not support usually comes down, and the weeks lost cost more than a realistic starting price would. Use our free property value calculator, which now includes sales through October 30, and ask for a Broker Opinion of Value for a number built on your own rent roll.
Know where the tax lines fall. About 11% of sales this year closed above $5.4 million, the point where the City of Los Angeles’s Measure ULA transfer tax begins. CoStar notes that efforts to revise the measure did not make the November ballot. If your building is near a threshold, read our guide to Measure ULA before you set a price.
Think about year-end early. If you want to close in 2026 for tax reasons, a sale that starts in November is already tight. See our guides to selling before year-end and 1031 exchanges.
What We Are Watching in November
The 10-year Treasury. A close back above 5% would put pressure on buyers again, and a move lower would help.
Whether the cap rate keeps its distance from the Treasury. If it narrows further, we expect more price negotiation, not less.
The rest of October’s sales. As CoStar records them, we will see whether the early look at fourth-quarter pricing holds.
Supply. CoStar expects fewer new apartments from 2027, which is the main reason it forecasts vacancy to improve.
We plan to publish this report each month, with a longer update each quarter. See our third-quarter update for the numbers through September 22.
About the Data
Treasury yields are the U.S. Department of the Treasury’s daily par yield curve rates for the 10-year maturity. Market statistics in the CoStar section come from CoStar’s Los Angeles Multi-Family Market Report dated October 30, 2026, and are paraphrased. The sales analysis, neighborhood figures, and opinions are Highlight Multifamily Group’s, based on CoStar sales data through October 30, 2026. Cap rates come from the sales that reported one, and we use medians throughout.
Recent sales are recorded with a delay, so the latest weeks will look different as more are added. This article is general information, not legal, tax, or investment advice, and not an appraisal.
Talk With Us
To see how this market applies to your building, start with our free property value calculator, then request a free Broker Opinion of Value. We will build it from your rents, expenses, and condition.
Frequently Asked Questions
Where did the 10-year Treasury yield end October 2026?
The 10-year Treasury closed at 4.94% on October 30, 2026, the last trading day of the month. It was 5.29% on September 30 and reached 5.31% on October 5, so it ended the month about 35 basis points lower than it began.
What did LA apartment buildings sell for in October 2026?
Older buildings (built before 1978) sold in LA County for a median of $220,417 per unit from January 2 through October 30, 2026, and $237,778 in October so far. October’s sales are still being recorded, so the month’s figure may change. Prices have been steady all year.
What cap rate are LA apartment buildings selling at?
The median cap rate on older LA County apartment buildings was 5.96% for 2026 through October 30, and the middle half of sales were between 5.21% and 6.65%. Neighborhoods differ a lot. See our cap rates and prices by neighborhood.
What is the vacancy rate for Los Angeles apartments?
CoStar’s October 30, 2026 report puts overall LA multifamily vacancy at 5.5%, compared with 7.9% nationally. Newer, higher-priced buildings have the most vacancy (9.4%), while older, lower-priced buildings are the tightest (4.6%).
Is now a good time to sell an LA apartment building?
It depends on your goals, your tax position, and your building. Prices have been steady in 2026, buyers are negotiating, and Treasury yields eased in October. Start with a free Broker Opinion of Value so you can see a realistic price and your likely net proceeds, then decide. Our guide on whether to sell covers the questions to ask first.