
LA Apartment Market Update, Q3 2026: Prices, Cap Rates, and How Far Below Asking Buildings Sold
Q4 2026
Key Takeaways
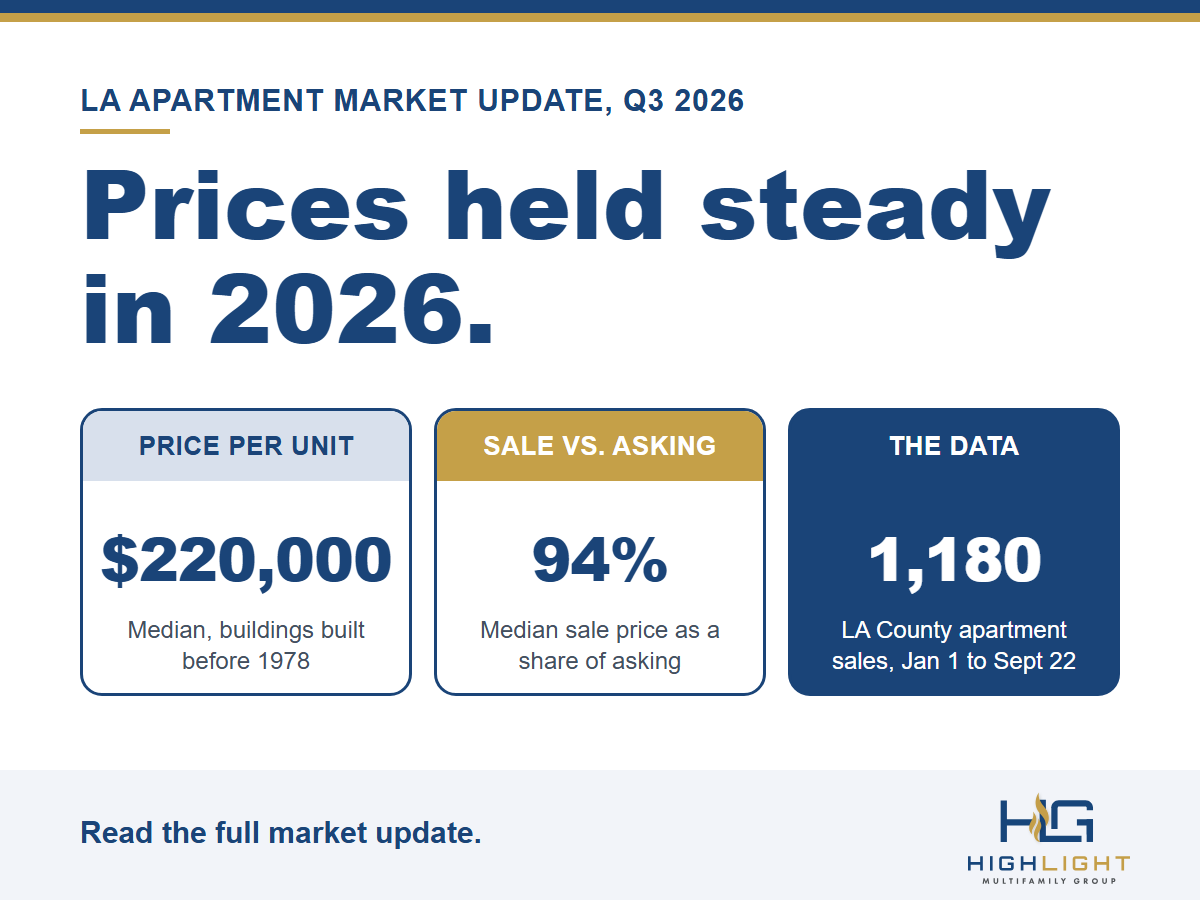
Prices were steady. From January 1 to September 22, 2026, older LA County apartment buildings (built before 1978) sold for a median of $220,000 per unit. Each quarter stayed close to that: $220,000, $219,167, and $225,000.
Cap rates barely moved. The median cap rate on older buildings was 5.91%, 5.99%, and 5.96% across the three quarters.
Smaller buildings sold for more per unit. Older buildings of 5 to 9 units sold for a median of $237,222 per unit, compared with $185,796 for 20 to 49 units.
Sellers rarely got their asking price. Of the sales with a recorded asking price, about 85% closed below it, and the median sale was 94% of asking.
What We Measured
This update covers 1,180 sales of apartment buildings with 5 to 99 units in Los Angeles County, from January 1 to September 22, 2026, taken from CoStar sales data and analyzed by Highlight Multifamily Group. We left out sales whose price CoStar marks as approximate or allocated, portfolio sales of 100 or more units, and repeated records. Older buildings are those built before 1978, which in the City of Los Angeles are generally rent-controlled.
We only have 2026 so far, so this update cannot say how this year compares with last year. The third quarter runs through September 22, so it is not a full quarter. Cap rates come from the sales that reported one, and we use medians throughout so that a few very large or very small sales do not distort the picture.
The Headline Numbers
Older buildings made up 84% of sales but 65% of the dollars. Newer buildings, built in 1978 or later, were 16% of sales and 35% of the dollars. They sold for a median of $321,429 per unit, about 46% more than the $220,000 for older buildings.
In the City of Los Angeles, older buildings are generally rent-stabilized and newer ones are not, which is one reason the two can trade differently. Our guide to how buyers value an apartment building explains the math behind price per unit and cap rate.
| All sales | Built before 1978 | Built 1978 or later | |
|---|---|---|---|
| Sales | 1,180 | 987 | 193 |
| Dollar volume | $3.97 billion | $2.59 billion | $1.38 billion |
| Median price per unit | $231,548 | $220,000 | $321,429 |
| Median price per square foot | $292 | $284 | $325 |
| Typical cap rate range | 5.13% to 6.59% | 5.21% to 6.64% | 5.00% to 6.34% |
| Sales that reported a cap rate | 834 | 689 | 145 |
Source: Highlight Multifamily Group analysis of CoStar sold multifamily comps, buildings of 5 to 99 units. The cap rate range is the middle half of sales that reported one.
Quarter by Quarter
Sales volume peaked in the second quarter, with 470 sales worth $1.64 billion. The third quarter had 346 sales through September 22, which is not a full quarter.
Prices did not move much. Older buildings sold for a median of $220,000 per unit in the first quarter, $219,167 in the second, and $225,000 in the third so far, a spread of about 3% from lowest to highest.
The median cap rate on older buildings stayed between 5.91% and 5.99%. Nothing in these numbers shows prices rising or falling sharply this year, and the share of the asking price that buyers paid was steady too.
| Quarter | All sales | Dollar volume | Older buildings: median price per unit | Older buildings: median cap rate | Median sale price as % of asking |
|---|---|---|---|---|---|
| Q1 | 364 | $1.29 billion | $220,000 | 5.91% | 93.8% |
| Q2 | 470 | $1.64 billion | $219,167 | 5.99% | 94.4% |
| Q3 (through Sept 22) | 346 | $1.04 billion | $225,000 | 5.96% | 93.9% |
Source: Highlight Multifamily Group analysis of CoStar sold multifamily comps. Older buildings were built before 1978. The latest quarter is not a full quarter.
Bigger Buildings Sell for Less Per Unit
Buyers pay less per unit as buildings get bigger, and they accept a higher cap rate. Older buildings of 5 to 9 units sold for a median of $237,222 per unit, about 28% more than the $185,796 paid for 20 to 49 units. Median cap rates rose from 5.86% for 5 to 9 units to 6.03% for 20 to 49 units.
Buildings of 50 to 99 units had only 15 older-building sales, so treat that group as a rough guide. Our data starts at 5 units, so it does not cover duplexes, triplexes, or fourplexes; our article on selling a small building explains how those are priced.
If you own a smaller building, the per-unit price you see for your neighborhood as a whole may understate what a building of your size can fetch, and the reverse can be true for a larger one. That is why we price from your own building and the sales closest to it in size and age.
Source: Highlight Multifamily Group analysis of CoStar sold multifamily comps. The 50 to 99 unit group has few sales, so treat it as a rough guide.
How Far Below Asking Did Buildings Sell?
CoStar recorded an asking price for 630 of the 1,180 sales. In those, the median sale price was 94% of the asking price, about $145,000 below it. Only 15% sold at or above asking, and 28% sold for more than 10% less.
The gap was wider for bigger buildings. The median sale price was 94.7% of asking for 5 to 9 units, 93.5% for 10 to 19 units, 91.8% for 20 to 49 units, and 84.6% for 50 to 99 units (11 sales, a small group). The gap was steady from quarter to quarter.
In our view, this is the clearest reason to price a building from its income and comparable sales, not from what you hope to get. A price that starts too high costs weeks, and buyers tend to find the gap anyway. Our step-by-step guide to selling shows where pricing fits in the process.
Source: Highlight Multifamily Group analysis of CoStar sold multifamily comps. Asking price is the one CoStar recorded for the sale.
Who Bought and Sold
Private owners drove the market. About 85% of the sales had a private buyer and 89% had a private seller, and institutions were about 2% of buyers. About 69% of buyers were based locally and 24% were based elsewhere in the United States.
Sales by Price Range
About 89% of sales closed below $5.4 million. The other 132 sales (11%) were above it, and 77 were $8 million or more.
Those lines matter. In the City of Los Angeles, the Measure ULA transfer tax starts above $5.4 million, and in Santa Monica, Measure GS starts at $8 million. Whether either applied to a given sale depended on where the building was. Our guide to Measure ULA thresholds explains why a price just over the line can cost a seller money.
Source: Highlight Multifamily Group analysis of CoStar sold multifamily comps. Gold bars are sales above $5.4 million, where the City of LA’s Measure ULA begins. Whether it applied depends on where the building is.
Neighborhood Detail
For prices and cap rates by neighborhood, see our article on LA apartment cap rates and prices by neighborhood, or find your area on our submarkets page.
What This Means If You Own an Apartment Building
Price from income and comparable sales. With the typical sale closing about 6% below asking, an asking price that is not backed by your rents and recent sales tends to come down.
Know your size bracket. Buyers pay different prices per unit for a 7-unit building and a 30-unit building, so the comparable sales that matter most are the ones near yours in size and age.
Have your paperwork ready. Buyers ask for the rent roll, leases, registration, and expense records on day one, and a complete set keeps your price intact in escrow.
Look at what you keep, not just the price. Capital gains tax and depreciation recapture can take a large share of the proceeds, so run the numbers early with your CPA. Our guide to capital gains and depreciation recapture explains the pieces.
Use the current rules. In the City of Los Angeles, the allowable rent increase for rent-controlled units is 3% through June 2027, and the AB 1482 cap has been 8.7% since August 1, 2026. Measure ULA thresholds adjust every July 1. See our guides to the 2026 AB 1482 rent cap and selling with tenants under rent control.
Talk With Us
To see how these numbers apply to your building, start with our free property value calculator, then request a free Broker Opinion of Value and we will build it from your rents, expenses, and condition. We refresh this analysis every quarter.
This article is general information, not an appraisal, investment advice, or a forecast. Figures are medians from CoStar sales data through September 22, 2026 and will change as more sales close and records are updated.
Frequently Asked Questions
Are apartment prices in Los Angeles going up or down in 2026?
Based on our CoStar data through September 22, 2026, prices were steady. Older apartment buildings in LA County sold for a median of $220,000 per unit in the first quarter, $219,167 in the second, and $225,000 in the third so far. We only have 2026, so we cannot compare it with last year.
How many apartment buildings sold in Los Angeles County in 2026?
From January 1 to September 22, 2026, 1,180 apartment buildings of 5 to 99 units sold in LA County for about $3.97 billion in total, after we left out approximate prices, portfolio sales of 100 or more units, and repeated records.
What is a typical cap rate for an apartment building in LA County in 2026?
Older buildings (built before 1978) had a median cap rate of 5.94%, with the middle half of sales between 5.21% and 6.64%. Newer buildings had a median of 5.51%, with the middle half between 5.00% and 6.34%. These come from the 689 and 145 sales that reported a cap rate.
Do bigger apartment buildings sell for less per unit?
Yes. Older buildings of 5 to 9 units sold for a median of $237,222 per unit in 2026, compared with $200,000 for 10 to 19 units, $185,796 for 20 to 49 units, and $167,284 for 50 to 99 units, a small group of 15 sales.
How far below the asking price do apartment buildings sell for in Los Angeles?
Of the 630 sales with a recorded asking price, the median sale price was 94% of asking, about $145,000 below it. About 85% sold below asking, and 28% sold for more than 10% less. Larger buildings sold further below asking than smaller ones.
Who is buying apartment buildings in Los Angeles?
Mostly private owners. About 85% of 2026 sales had a private buyer, about 69% of buyers were based locally and 24% elsewhere in the United States, and institutions were about 2% of buyers.