
How to Analyze an LA Apartment Building: Cap Rate, Cash-on-Cash, and GRM
Q4 2026
Key Takeaways
Net operating income (NOI) is the building’s income after operating expenses and before loan payments. Almost every other measure starts from it.
The cap rate is NOI divided by price. It tells you the return if you bought the building with all cash.
Cash-on-cash return and debt service coverage show how a loan changes the picture, for better or worse.
In Los Angeles, rent control limits how fast income can grow, so a building’s price should be judged on the rents in place, not on what the rents could be.
Step 1: Net Operating Income
Start with the rent the building actually collects over a year. Subtract operating expenses: property tax, insurance, utilities, repairs and maintenance, management, and a vacancy allowance. Do not subtract loan payments or income taxes. What is left is the NOI.
Expenses are the number buyers most often get wrong. As a rough guide, the expense ratios our own free property value calculator uses are 37% to 47% of rent for buildings built before 1935, 37% to 42% for other rent-controlled buildings, and 32% to 36% for buildings built in 1978 or later. Your building’s actual bills matter far more than any rule of thumb.
Step 2: Cap Rate
The capitalization rate is NOI divided by the price. If you know the NOI and the cap rate buyers are paying, flip it around: value is NOI divided by the cap rate. A lower cap rate means buyers are paying more for each dollar of income. Cap rates differ a lot between neighborhoods and between older and newer buildings, which is why we publish the 2026 ranges in our guide to cap rates and prices by neighborhood.
Step 3: GRM and Price Per Unit
The gross rent multiplier (GRM) is the price divided by the year’s gross rent. It is quick, and it ignores expenses, so it can mislead when two buildings have different costs. Price per unit and price per square foot are also quick checks, not valuations. Use them to see whether a price is in the range of recent sales, and use NOI to decide whether it is worth paying.
A Worked Example
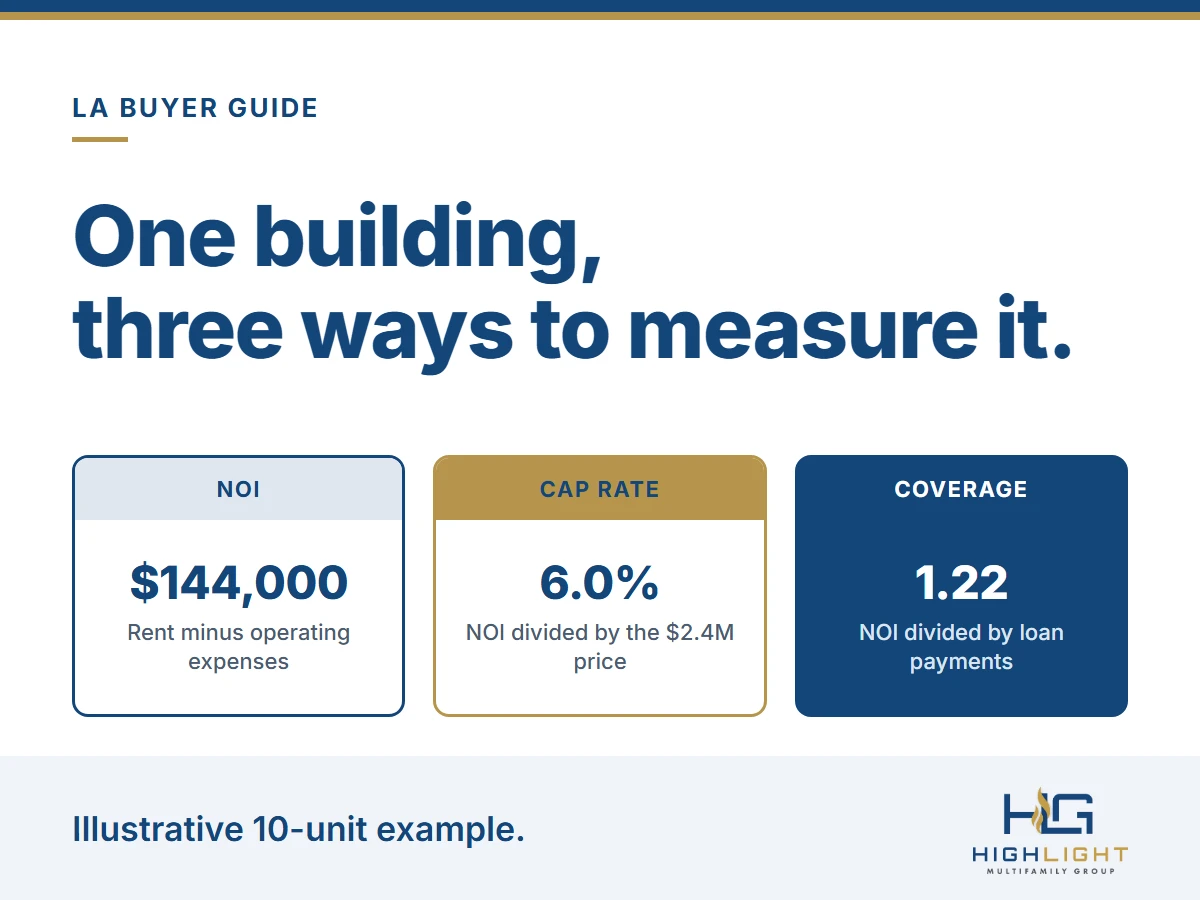
These numbers are illustrative assumptions, not a quote or a forecast. A 10-unit building collects $240,000 of rent a year. Operating expenses, including a vacancy allowance, are 40% of that, or $96,000, so the NOI is $144,000.
At a 6.0% cap rate, the value is $144,000 divided by 0.06, or $2,400,000. That is $240,000 per unit and a GRM of 10.0 ($2,400,000 divided by $240,000 of rent).
Now add a loan: 65% of the price, or $1,560,000, on a 30-year schedule at 6.5%. The year’s payments are about $118,300, so the DSCR is $144,000 divided by $118,300, or 1.22. The cash flow after the loan is about $25,700. The buyer put in $840,000 of equity, so the cash-on-cash return is about 3.1%, before closing costs.
The building earned 6.0% on the price, and the loan lowered the buyer’s return, because borrowing at 6.5% costs more than the building yields. That is why the rate matters as much as the price. At 5.0%, the payments would be about $100,500, the DSCR 1.43, and the cash-on-cash return about 5.2%.
What Rent Control Does to the Numbers
In a rent-stabilized building, the City’s published annual increase is 3%, and in newer buildings the statewide AB 1482 cap is 8.7% for increases effective on or after August 1, 2026. On our example, a 3% increase adds $7,200 a year, and at a 6.0% cap rate that income is worth about $120,000. See our guides to the City’s RSO changes and the AB 1482 cap.
Under-market rents on a rent-controlled building look like upside, but the owner cannot capture it until units turn over. Price the building on the rents in place, and treat any upside as a bonus.
Reality Checks Before You Offer
Use the actual rent roll and bills, not a pro forma. Rebuild the NOI yourself and see whether it matches the seller’s.
Compare the cap rate with recent sales in the same neighborhood and age group, not a citywide average.
Run your loan at today’s quote, and check the DSCR and the cash-on-cash return. See our guide to financing an apartment building.
Look ahead to your exit. If a future sale could land above $5.4 million inside the City of Los Angeles, the Measure ULA tax applies to the whole price; see our Measure ULA calculator.
Do the due diligence. Our checklist covers what can change the numbers.
Talk With Us
If you want a second set of eyes on a building you are considering, contact us. We represent buyers as well as sellers and can run the numbers with you. This article is general information, not investment advice.
Frequently Asked Questions
How do I calculate the cap rate on an apartment building?
Divide the net operating income by the price. If the building earns $144,000 of NOI and sells for $2,400,000, the cap rate is 6.0%. Flip it around to value a building: NOI divided by the cap rate.
What is net operating income (NOI)?
The rent the building collects in a year, minus operating expenses such as property tax, insurance, utilities, repairs, management, and a vacancy allowance. It does not subtract loan payments or income taxes.
What is the gross rent multiplier (GRM)?
The price divided by the year’s gross rent. A $2,400,000 building with $240,000 of rent has a GRM of 10.0. It is a quick check that ignores expenses, so it can mislead when two buildings cost different amounts to run.
What is cash-on-cash return?
The year’s cash flow after loan payments, divided by the cash you invested. In our example, about $25,700 of cash flow on $840,000 of equity is a return of about 3.1%.
How does rent control change how I should analyze a building?
Price the building on the rents in place. In a rent-stabilized building the City’s published annual increase is 3%, and units reach market rent only when tenants leave, so below-market rents are upside you cannot count on. See our guide to the City’s RSO changes.
What expense ratio should I assume for an LA apartment building?
Our free property value calculator assumes 37% to 47% of rent for buildings built before 1935, 37% to 42% for other rent-controlled buildings, and 32% to 36% for buildings built in 1978 or later. Use the building’s actual bills whenever you have them.